Friday 15 April 2016

Six Sigma Project - Control Phase


Six Sigma Project - Control Phase
Assembly and test capacity expansion.

Control Phase
The purpose of the control phase is to maintain the gains that have been achieved by standardizing work method and processes. The control process should make plans to preserve the lessons learned from the earlier phases to enhance continual improvement.

Six Sigma 6S manufacturing services procedure.
A manufacturing services procedure and checklist was developed to maintain a 6S culture. This will ensure the maintenance of a clean safe assembly and test environment which will inevitably lead to a reduction in non conformances. 

Clean room check list
To maintain the cleanliness and housekeeping in the assembly clean room a daily, weekly and monthly sign off sheet (Fig 20) was developed. The checks are carried out by the supervisor and the operators to ensure a good culture is developed.


Fig 20: Excerpt from the clean room cleanliness control sign off sheet. Click image to enlarge

Borescope Inspection.
To control the cleanliness of the manifolds and to verify that the de-burring process is completed correctly a new Borescope inspection camera (See Fig 21) was purchased. All manifold bores are inspected by the quality control inspection department and signed off before assembly.

Fig 21: Borescope for manifold bore inspection, Click image to enlarge.
 
Automatic washer for manifolds
After the de-burring process all manifolds are cleaned in a new automatic washer. (Fig 22) This removes all debris from the de-burring process which is also verified by QC inspection using the Borescope. Only items that have been passed and signed off by inspection can be issued to assembly, controlled by the SAP ERP system.

Fig 22: Automatic manifold washer,center. With 2 Manifolds. Click image to enlarge

Improvement to job routings
The routing have been revised to reflect the savings realized by the improvements made in the improve phase. This has resulted in a reduction in assembly and test time of 7 hours which equates to an annual saving of €102,000. The new routings will now be the new standard work method going forward.
Fig 23: Old and new routing layouts. Click image to enlarge.
Increase in production output.
All the improvements done to date have significantly reduced production time and waste. The introduction of the new flow rig to test bay C while maintaining test bay A and the automation of the test processes will ensure that production will increase from 12 units per month to 18 units per month, an increase of 50%. 
Training and control of the new calibration flow rig.
A training program has been developed by the manufacturer of the new calibration flow rig. The training will be carried out on an ongoing basis by the R+D engineering group who developed the software. All personnel who receive training will have their training records updated accordingly. Only trained personnel will have the authority to log on to the control HMI interface and operate the flow rig. A preventative maintenance (PM) schedule has been drawn up for the upkeep and servicing of the new rig.

Next Steps
The team have now completed the all five phases of the DMAIC process. (Define, Measure, Analyze, Improve and Control), This does not mean by any means that all work is complete, the control phase is a continuing process that can be further developed and modified to make continual improvement going forward.

Sunday 3 April 2016

Six Sigma Project - Improve Phase

Six Sigma Project - Improve Phase
Assembly and test capacity expansion.

Improve Phase
The purpose of the improve phase is to carry out improvements and work towards moving from the current state value stream to the desired future state value stream. This blog entry will show how the team carried out the improvements.

"Just do it" items
The "just do it items" identified in the measure and analyze phases have been actioned and purchase orders have been placed for new equipment.

Action plan CSVSM to FSVSM
An action plan was put in place to bring the current state value stream map in line with the future state value stream map, as follows.
  • Devise method of de-burring manifolds.
  • Purchase new assembly fixtures.
  • Create new clean room layout to accommodate dual assembly.
  • Introduce preventative maintenance schedule for flow rig filtration change.
  • Design and purchase new flow rig.
  • Create new test bay layout to house new flow rig, use Test Bay C.
  • Automation of Flow Rig.
  • Modify assembly and test work order routings in line with FSVSM.
De-burring of manifolds
We were having problems during the assembly procedure with burrs on the small diameter internal bores on the manifolds. We procured a simple de-burring tool which fits in a standard hand drill. (See Fig: 15)

Fig 15: New manifold de-burring attachment, Click image to enlarge.


Purchase new assembly fixtures
Two new assembly fixtures were purchased and are now in place.

Improvements in layout for assembly clean room
The current layout in the assembly clean room is cramped and allows only enough space for one operator to assemble one product at a time. The new layout drawing below Fig: 16 shows the new layout which makes better use of the space by incorporating a new corner bench, This allows adequate space for two products to be assembled simultaneously.
Fig 16: New assembly clean room layout drawing, Click image to enlarge.
Improvements in layout of Test Bay C
The team made a decision to leave the present calibration flow test rig at Test Bay A and to install the new Automated Flow Rig at Test bay C. Test bay C is not being used due to a serious drop in demand for the product line it supported. The below drawing Fig 17 shows how the new flow rig is being incorporated. We will use Test Bay C for most testing and support it with the old manual unit at test Bay A, (e.g. For rework, Surge in demand, Etc.)
Fig 17: New Layout drawing for Test Bay C test cell showing the location of the new flow rig.
Click image to enlarge.


Automation of flow rig
A new software application was developed by the R+D group using the LABVIEW programming environment. This will fully automate the calibration process for Product A. The new system will mean that we will no longer have to rely on the specialized skills of a few operators and we will have an automated system that anyone can use with a small amount of training. (See GUI below Fig 18)

Fig 18: New automated flow rig graphical user interface, Click image to enlarge
Future State Spaghetti Diagram
A new future state spaghetti diagram, (Fig:19), was generated using the new work breakdown structure and future state value steam map created during the analyze phase. It can be clearly seen that the waste of movement has been reduced significantly, by comparing the new spaghetti diagram to the original current state spaghetti diagram.

Fig19: Future State spaghetti diagram, Click image to enlarge.
Next Steps
The team have now completed the first four phases of the DMAIC process. (Define, Measure, Analyze, Improve and Control), The team will now move forward to the control phase. 


Saturday 12 March 2016

Six Sigma Project - Analyse Phase

Six Sigma Project - Analyse Phase
Assembly and test capacity expansion.

Analyse Phase
The purpose of the analyse phase is to analyse the data and information collected during the define and measure phases to identify where improvements can be made. This entry in the blog will show how the team carried out the analysis.


MURI Analysis
During the Measure phase it was established that Test Bay A which has the bespoke flow rig is the constraint at 34.1 hours total time per unit. The team carried out the future state work breakdown analysis to identify if the work load could be rearranged so that Test Bay A would not be overburdened (MURI). It was established that many of the tests being carried out in the test bay could be carried out elsewhere. The future state work breakdown structure below (Fig 10) shows that the time in Test Bay A bay could be reduced to 17.5 total hours per unit.
Fig 10: Future State Work Breakdown Structure, Click image to enlarge.
Future State Value Stream Map (FSVSM)
The future state value stream map below (Fig 11) was created from the data analysed in the work breakdown structure. This FSVSM will now be the target going forward and the work routings will be modified to match this new value stream. A plan will be put in place to move the Current State value Stream Map (CSVSM) in line with the FSVSM.

Fig 11: Future State Value Stream Map, Click image to enlarge.
Future State Production Drum Rope Diagram
A new production drum rope diagram (Fig 12) was generated from the FSVSM to show that the second, third and subsequent units should be scheduled to start at 30 hour intervals to ensure no clash of resources. The product will no longer have to wait in inventory before the Test Bay A constraint.

Fig 12: Future State Production Drum Rope Diagram, Click image to enlarge.
New Equipment
The team identified the requirement for new equipment in the measure phase that fell into the implement quadrant of the Benefit Versus Effort chart. As these items are "Just Do It" items the team immediately started the procurement process. The concept images of the new equipment are shown below in Fig 13 and Fig 14. The new automated flow rig will replace the old manual flow rig at Test Bay A. The new assembly fixtures will allow more that one item to be assembled at a time.


Fig 13: Flow Rig.

Fig 14: Assembly Fixture.


Next Steps

The team have now completed the first three phases of the DMAIC process. (Define, Measure, Analyze, Improve and Control), The team will now move forward to the Improve phase. 


Friday 29 January 2016

Six Sigma Project - Measure Phase

Six Sigma Project - Measure Phase
Assembly and test capacity expansion.

Measure Phase
The purpose of the measure phase of the Six Sigma DMAIC process is to get as much details as possible of the current processes and to understand how the system is currently working. To do this we created a current work breakdown matrix (Fig 6) which shows how much time the product spends for each process in each cell location. To do this the team gathered baseline data and summarized the data in a chart so that is can easily be analyzed. This shows clearly that Test Bay A is the constraint as it has the biggest loading at 34.1 hours for each of Product A followed closely by the Clean Room at 29.5 hours.

Current Work Breakdown
Fig 6: Product A, Current Work Breakdown, Click image to enlarge.

Production Drum Rope Diagram
When the the above information is laid out in a production drum rope configuration. (Fig 7), it can be seen that Test Bay A is not available when needed by the second production unit. The second unit must wait until Unit 1 is completely finished in Test bay A so that Unit 1 is not delayed. This raises the non value added time for unit 2 as it has to wait in inventory. This has a serious affect on lead time to the customer.
Fig 7: Production Drum Rope Diagram, Click image to enlarge.
Fishbone Diagram
The team then decided to document the existing problems to identify areas for improvement. The tool chosen for this is the Fishbone diagram as shown in Fig 8.
Fig 8: Fishbone Diagram of current problems, Click image to enlarge
Existing Equipment
Photo 1: Manual Flow Rig, Test Bay A
Photo 2: Assembly Fixture


Brain Storming
The team carried out a brain storming and came up with a variety of improvement ideas. The ideas were then laid out on a Benefits Versus Effort Chart (Fig 9) to identify the low lying fruit versus the non runners. It was decided at this stage that the non conformance problems would be addressed in a separate green belt project as it is beyond the scope of this project. 
Fig 9: Benefits Versus Effort Chart, Click image to enlarge.

Immediate Actions Required
The items in the Implement quarter are "just do it" items and will be carried out right away to show an immediate improvement. The items in both the Challenge quarter and the Possible quarter will move forward to the Analyse phase. The remaining items in the Kill quarter will be dropped for now but can be kept on file for future consideration.

The team have now completed the first two phases of the DMAIC process. (Define, Measure, Analyze, Improve and Control), We will now move forward to the Analyze phase.


Thursday 28 January 2016

Six Sigma Project - Define Phase

Six Sigma Project - Define Phase
Assembly and test capacity expansion

Fig 1: Product A
Weight 125kg
Project Purpose
The purpose of this Six Sigma Project is to expand the present assembly and test capability for the manufacture of Product A, as shown in the Fig 1, and also mating products B and C. We presently have one test enclosure (Test Bay A) with a bespoke flow test rig that is required to test all three products. Test Bay A is the constraint for the entire production line and each of the products have to visit the test bay for 3 processes of their factory acceptance testing. As a result the tree products often have to wait in inventory for the test enclose to become available which has a serious impact on lead time and overall cost to the customer. We are presently just managing to produce approx 12 units per month of the 3 mating components.

Voice Of The Customer
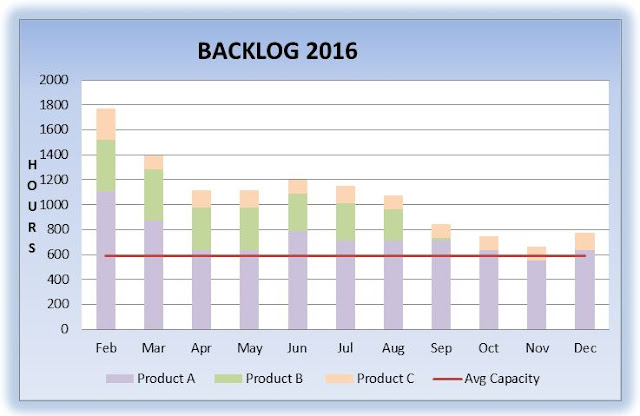
Fig 2 below shows the hours required per month to produce the 3 products and the average capacity of a 2 cycle shift for 2 employees. The chart shows clearly that present production capability does not meet the current customer demand. We will also have to schedule in all new orders received throughout the year. This will have a severe impact on lead time with current lead time being quoted at 30-34 weeks. Our customers are requesting a reduction in lead time.
Fig 2: Backlog showing inability of current system to meet customer demand
Define Stage
The following spaghetti diagram shows the movement of the three product throughout the various cells in the factory. The cells are located close together as some resources are shared such as the gas test bay and hyperbaric chamber.
Fig 3: Spaghetti diagram showing the paths of the raw material and assembled products A,B & C
The Spaghetti diagram shows the movement of Product A,B and C through the various stages of assembly and test, This is further outlined in the Value Stream Map Below. My experience of using the spaghetti diagram is that it is hard to see exactly what is happening as you fill in all the multiple travel paths. The value stream map below helps to show the exact sequence of events.
Fig 4: VSM showing the stages of manufacture and the inventory areas where the product has to wait for and unknown period for Test Bay A to be available.


Non Conformance Reports
We also have issues with non conforming product which has to be reworked and retested in Test bay A which leads to waiting and increase in difficulty to schedule production
Fig 5: Non Conformance Reports 2013 - 2015
Project Charter 
The project charter has been completed and details will be included in the interim report to include.
  • Project opportunity description
  • Quantitative output variable
  • Business Result
  • Linked Metrics
  • Impact on customers
  • Project Risks
  • Team Members and roles
  • Project Scope detail, (included and excluded) 
  • Project Deliverables
  • Additional internal and external support required. 
Measure stage
The next step is to move on to the project measure stage.