Assembly and test capacity expansion
 |
| Fig 1: Product A Weight 125kg |
Project Purpose
The purpose of this Six Sigma Project is to expand the present assembly and test capability for the manufacture of Product A, as shown in the Fig 1, and also mating products B and C. We presently have one test enclosure (Test Bay A) with a bespoke flow test rig that is required to test all three products. Test Bay A is the constraint for the entire production line and each of the products have to visit the test bay for 3 processes of their factory acceptance testing. As a result the tree products often have to wait in inventory for the test enclose to become available which has a serious impact on lead time and overall cost to the customer. We are presently just managing to produce approx 12 units per month of the 3 mating components.
Voice Of The Customer
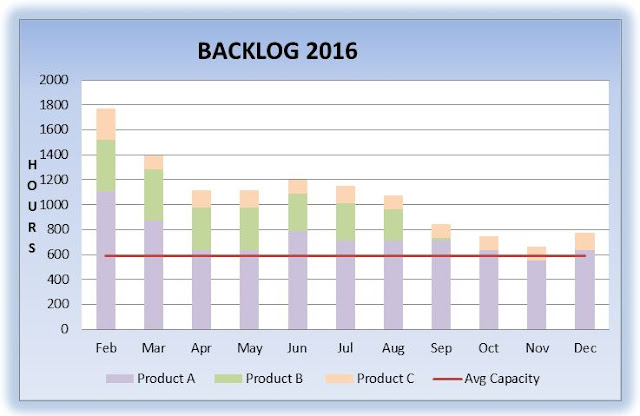
Fig 2 below shows the hours required per month to produce the 3 products and the average capacity of a 2 cycle shift for 2 employees. The chart shows clearly that present production capability does not meet the current customer demand. We will also have to schedule in all new orders received throughout the year. This will have a severe impact on lead time with current lead time being quoted at 30-34 weeks. Our customers are requesting a reduction in lead time.
 |
| Fig 2: Backlog showing inability of current system to meet customer demand |
Define Stage
The following spaghetti diagram shows the movement of the three product throughout the various cells in the factory. The cells are located close together as some resources are shared such as the gas test bay and hyperbaric chamber.
 |
| Fig 3: Spaghetti diagram showing the paths of the raw material and assembled products A,B & C |
| The Spaghetti diagram shows the movement of Product A,B and C through the various stages of assembly and test, This is further outlined in the Value Stream Map Below. My experience of using the spaghetti diagram is that it is hard to see exactly what is happening as you fill in all the multiple travel paths. The value stream map below helps to show the exact sequence of events. |
 | |||
| Fig 4: VSM showing the stages of manufacture and the inventory areas where the product has to wait for and unknown period for Test Bay A to be available. |
Non Conformance Reports
We also have issues with non conforming product which has to be reworked and retested in Test bay A which leads to waiting and increase in difficulty to schedule production
 |
| Fig 5: Non Conformance Reports 2013 - 2015 |
Project Charter
The project charter has been completed and details will be included in the interim report to include.
- Project opportunity description
- Quantitative output variable
- Business Result
- Linked Metrics
- Impact on customers
- Project Risks
- Team Members and roles
- Project Scope detail, (included and excluded)
- Project Deliverables
- Additional internal and external support required.
The next step is to move on to the project measure stage.
No comments:
Post a Comment