Friday 29 January 2016

Six Sigma Project - Measure Phase

Six Sigma Project - Measure Phase
Assembly and test capacity expansion.

Measure Phase
The purpose of the measure phase of the Six Sigma DMAIC process is to get as much details as possible of the current processes and to understand how the system is currently working. To do this we created a current work breakdown matrix (Fig 6) which shows how much time the product spends for each process in each cell location. To do this the team gathered baseline data and summarized the data in a chart so that is can easily be analyzed. This shows clearly that Test Bay A is the constraint as it has the biggest loading at 34.1 hours for each of Product A followed closely by the Clean Room at 29.5 hours.

Current Work Breakdown
Fig 6: Product A, Current Work Breakdown, Click image to enlarge.

Production Drum Rope Diagram
When the the above information is laid out in a production drum rope configuration. (Fig 7), it can be seen that Test Bay A is not available when needed by the second production unit. The second unit must wait until Unit 1 is completely finished in Test bay A so that Unit 1 is not delayed. This raises the non value added time for unit 2 as it has to wait in inventory. This has a serious affect on lead time to the customer.
Fig 7: Production Drum Rope Diagram, Click image to enlarge.
Fishbone Diagram
The team then decided to document the existing problems to identify areas for improvement. The tool chosen for this is the Fishbone diagram as shown in Fig 8.
Fig 8: Fishbone Diagram of current problems, Click image to enlarge
Existing Equipment
Photo 1: Manual Flow Rig, Test Bay A
Photo 2: Assembly Fixture


Brain Storming
The team carried out a brain storming and came up with a variety of improvement ideas. The ideas were then laid out on a Benefits Versus Effort Chart (Fig 9) to identify the low lying fruit versus the non runners. It was decided at this stage that the non conformance problems would be addressed in a separate green belt project as it is beyond the scope of this project. 
Fig 9: Benefits Versus Effort Chart, Click image to enlarge.

Immediate Actions Required
The items in the Implement quarter are "just do it" items and will be carried out right away to show an immediate improvement. The items in both the Challenge quarter and the Possible quarter will move forward to the Analyse phase. The remaining items in the Kill quarter will be dropped for now but can be kept on file for future consideration.

The team have now completed the first two phases of the DMAIC process. (Define, Measure, Analyze, Improve and Control), We will now move forward to the Analyze phase.

Thursday 28 January 2016

Six Sigma Project - Define Phase

Six Sigma Project - Define Phase
Assembly and test capacity expansion

Fig 1: Product A
Weight 125kg
Project Purpose
The purpose of this Six Sigma Project is to expand the present assembly and test capability for the manufacture of Product A, as shown in the Fig 1, and also mating products B and C. We presently have one test enclosure (Test Bay A) with a bespoke flow test rig that is required to test all three products. Test Bay A is the constraint for the entire production line and each of the products have to visit the test bay for 3 processes of their factory acceptance testing. As a result the tree products often have to wait in inventory for the test enclose to become available which has a serious impact on lead time and overall cost to the customer. We are presently just managing to produce approx 12 units per month of the 3 mating components.

Voice Of The Customer
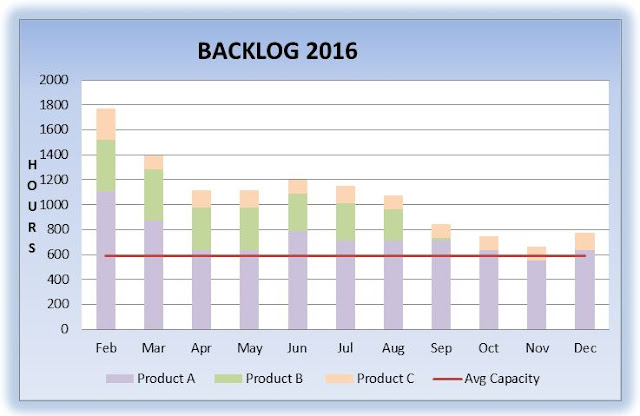
Fig 2 below shows the hours required per month to produce the 3 products and the average capacity of a 2 cycle shift for 2 employees. The chart shows clearly that present production capability does not meet the current customer demand. We will also have to schedule in all new orders received throughout the year. This will have a severe impact on lead time with current lead time being quoted at 30-34 weeks. Our customers are requesting a reduction in lead time.
Fig 2: Backlog showing inability of current system to meet customer demand
Define Stage
The following spaghetti diagram shows the movement of the three product throughout the various cells in the factory. The cells are located close together as some resources are shared such as the gas test bay and hyperbaric chamber.
Fig 3: Spaghetti diagram showing the paths of the raw material and assembled products A,B & C
The Spaghetti diagram shows the movement of Product A,B and C through the various stages of assembly and test, This is further outlined in the Value Stream Map Below. My experience of using the spaghetti diagram is that it is hard to see exactly what is happening as you fill in all the multiple travel paths. The value stream map below helps to show the exact sequence of events.
Fig 4: VSM showing the stages of manufacture and the inventory areas where the product has to wait for and unknown period for Test Bay A to be available.


Non Conformance Reports
We also have issues with non conforming product which has to be reworked and retested in Test bay A which leads to waiting and increase in difficulty to schedule production
Fig 5: Non Conformance Reports 2013 - 2015
Project Charter 
The project charter has been completed and details will be included in the interim report to include.
  • Project opportunity description
  • Quantitative output variable
  • Business Result
  • Linked Metrics
  • Impact on customers
  • Project Risks
  • Team Members and roles
  • Project Scope detail, (included and excluded) 
  • Project Deliverables
  • Additional internal and external support required. 
Measure stage
The next step is to move on to the project measure stage.